Brandon Bell/Getty Images
Jeremy Porter, City University of New York
Deadly and destructive flash flooding in Texas and several other states in July 2025 is raising questions about the nation’s flood maps and their ability to ensure that communities and homeowners can prepare for rising risks.
The same region of Texas Hill Country where a flash flood on July 4 killed more than 130 people was hit again with downpours a week later, forcing searchers to temporarily pause their efforts to find missing victims.
Other states across the Northeast, Mid-Atlantic and Midwest, and parts of New Mexico, also saw flash flood damage from powerful storms in July. Three people were swept away in New Mexico when an RV park flooded. Two others died in New Jersey after their car was pulled into floodwater. Parts of New York City’s subway system also flooded.
The U.S. Federal Emergency Management Agency’s flood maps are intended to be the nation’s primary tool for identifying flood risks. Originally developed in the 1970s to support the National Flood Insurance Program, these maps, known as Flood Insurance Rate Maps, or FIRMs, are used to determine where flood insurance is required for federally backed mortgages, to inform local building codes and land-use decisions, and to guide flood plain management strategies.
In theory, the maps enable homeowners, businesses and local officials to understand their flood risk and take appropriate steps to prepare and mitigate potential losses.

FEMA
But while FEMA has improved the accuracy and accessibility of the maps over time with better data, digital tools and community input, the maps still don’t capture everything – including the changing climate. There are areas of the country that flood, some regularly, that don’t show up on the maps as at risk.
I study flood-risk mapping as a university-based researcher and at First Street, an organization created to quantify and communicate climate risk. In a 2023 assessment using newly modeled flood zones with climate-adjusted precipitation records, we found that more than twice as many properties across the country were at risk of a 100-year flood than the FEMA maps identified.
Even in places where the FEMA maps identified a flood risk, we found that the federal mapping process, its overreliance on historical data, and political influence over the updating of maps can lead to maps that don’t fully represent an area’s risk.
What FEMA flood maps miss
FEMA’s maps are essential tools for identifying flood risks, but they have significant gaps that limit their effectiveness.
One major limitation is that they don’t consider flooding driven by intense bursts of rain. The maps primarily focus on river channels and coastal flooding, largely excluding the risk of flash flooding, particularly along smaller waterways such as streams, creeks and tributaries.
This limitation has become more important in recent years due to climate change. Rising global temperatures can result in more frequent extreme downpours, leaving more areas vulnerable to flooding, yet unmapped by FEMA.

Jeremy Porter
For example, when flooding from Hurricane Helene hit unmapped areas around Asheville, North Carolina, in 2024, it caused a huge amount of uninsured damage to properties.
Even in areas that are mapped, like the Camp Mystic site in Kerr County, Texas, that was hit by a deadly flash flood on July 4, 2025, the maps may underestimate their risk because of a reliance on historic data and outdated risk assessments.
Political influence can fuel long delays
Additionally, FEMA’s mapping process is often shaped by political pressures.
Local governments and developers sometimes fight to avoid high-risk designations to avoid insurance mandates or restrictions on development, leading to maps that may understate actual risks and leave residents unaware of their true exposure.
An example is New York City’s appeal of a 2015 FEMA Flood Insurance Rate Maps update. The delay in resolving the city’s concerns has left it with maps that are roughly 20 years old, and the current mapping project is tied up in legal red tape.
On average, it takes five to seven years to develop and implement a new FEMA Flood Insurance Rate Map. As a result, many maps across the U.S. are significantly out of date, often failing to reflect current land use, urban development or evolving flood risks from extreme weather.
This delay directly affects building codes and infrastructure planning, as local governments rely on these maps to guide construction standards, development approvals and flood mitigation projects. Ultimately, outdated maps can lead to underestimating flood risks and allowing vulnerable structures to be built in areas that face growing flood threats.
How technology advances can help
New advances in satellite imaging, rainfall modeling and high-resolution lidar, which is similar to radar but uses light, make it possible to create faster, more accurate flood maps that capture risks from extreme rainfall and flash flooding.
However, fully integrating these tools requires significant federal investment. Congress controls FEMA’s mapping budget and sets the legal framework for how maps are created. For years, updating the flood maps has been an unpopular topic among many publicly elected officials, because new flood designations can trigger stricter building codes, higher insurance costs and development restrictions.
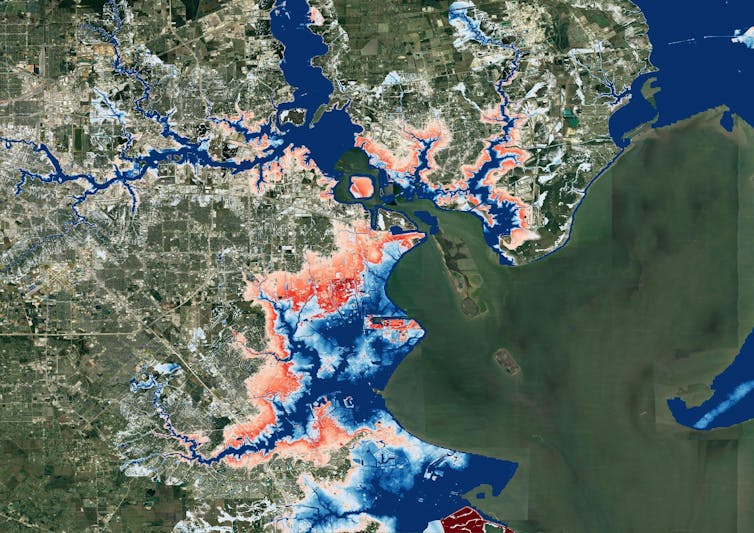
Oliver Wing et al., 2022
In recent years, the rise of climate risk analytics models and private flood risk data have allowed the real estate, finance and insurance industries to rely less on FEMA’s maps. These new models incorporate forward-looking climate data, including projections of extreme rainfall, sea-level rise and changing storm patterns – factors FEMA’s maps generally exclude.
Real estate portals like Zillow, Redfin, Realtor.com and Homes.com now provide property-level flood risk scores that consider both historical flooding and future climate projections. The models they use identify risks for many properties that FEMA maps don’t, highlighting hidden vulnerabilities in communities across the United States.
Research shows that the availability, and accessibility, of climate data on these sites has started driving property-buying decisions that increasingly take climate change into account.
Implications for the future
As homebuyers understand more about a property’s flood risks, that may shift the desirability of some locations over time. Those shifts will have implications for property valuations, community tax-revenue assessments, population migration patterns and a slew of other considerations.
However, while these may feel like changes being brought on by new data, the risk was already there. What is changing is people’s awareness.
The federal government has an important role to play in ensuring that accurate risk assessments are available to communities and Americans everywhere. As better tools and models evolve for assessing risk evolve, FEMA’s risk maps need to evolve, too.
This article, originally published July 12, 2025, has been updated with more flooding in the Northeast and Mid-Atlantic regions.![]()
Jeremy Porter, Professor of Quantitative Methods in the Social Sciences, City University of New York
This article is republished from The Conversation under a Creative Commons license. Read the original article.
FEMA
But while FEMA has improved the accuracy and accessibility of the maps over time with better data, digital tools and community input, the maps still don’t capture everything – including the changing climate. There are areas of the country that flood, some regularly, that don’t show up on the maps as at risk.
I study flood-risk mapping as a university-based researcher and at First Street, an organization created to quantify and communicate climate risk. In a 2023 assessment using newly modeled flood zones with climate-adjusted precipitation records, we found that more than twice as many properties across the country were at risk of a 100-year flood than the FEMA maps identified.
Even in places where the FEMA maps identified a flood risk, we found that the federal mapping process, its overreliance on historical data, and political influence over the updating of maps can lead to maps that don’t fully represent an area’s risk.
What FEMA flood maps miss
FEMA’s maps are essential tools for identifying flood risks, but they have significant gaps that limit their effectiveness.
One major limitation is that they don’t consider flooding driven by intense bursts of rain. The maps primarily focus on river channels and coastal flooding, largely excluding the risk of flash flooding, particularly along smaller waterways such as streams, creeks and tributaries.
This limitation has become more important in recent years due to climate change. Rising global temperatures can result in more frequent extreme downpours, leaving more areas vulnerable to flooding, yet unmapped by FEMA.
Jeremy Porter
For example, when flooding from Hurricane Helene hit unmapped areas around Asheville, North Carolina, in 2024, it caused a huge amount of uninsured damage to properties.
Even in areas that are mapped, like the Camp Mystic site in Kerr County, Texas, that was hit by a deadly flash flood on July 4, 2025, the maps may underestimate their risk because of a reliance on historic data and outdated risk assessments.
Political influence can fuel long delays
Additionally, FEMA’s mapping process is often shaped by political pressures.
Local governments and developers sometimes fight to avoid high-risk designations to avoid insurance mandates or restrictions on development, leading to maps that may understate actual risks and leave residents unaware of their true exposure.
An example is New York City’s appeal of a 2015 FEMA Flood Insurance Rate Maps update. The delay in resolving the city’s concerns has left it with maps that are roughly 20 years old, and the current mapping project is tied up in legal red tape.
On average, it takes five to seven years to develop and implement a new FEMA Flood Insurance Rate Map. As a result, many maps across the U.S. are significantly out of date, often failing to reflect current land use, urban development or evolving flood risks from extreme weather.
This delay directly affects building codes and infrastructure planning, as local governments rely on these maps to guide construction standards, development approvals and flood mitigation projects. Ultimately, outdated maps can lead to underestimating flood risks and allowing vulnerable structures to be built in areas that face growing flood threats.
How technology advances can help
New advances in satellite imaging, rainfall modeling and high-resolution lidar, which is similar to radar but uses light, make it possible to create faster, more accurate flood maps that capture risks from extreme rainfall and flash flooding.
However, fully integrating these tools requires significant federal investment. Congress controls FEMA’s mapping budget and sets the legal framework for how maps are created. For years, updating the flood maps has been an unpopular topic among many publicly elected officials, because new flood designations can trigger stricter building codes, higher insurance costs and development restrictions.
Oliver Wing et al., 2022
In recent years, the rise of climate risk analytics models and private flood risk data have allowed the real estate, finance and insurance industries to rely less on FEMA’s maps. These new models incorporate forward-looking climate data, including projections of extreme rainfall, sea-level rise and changing storm patterns – factors FEMA’s maps generally exclude.
Real estate portals like Zillow, Redfin, Realtor.com and Homes.com now provide property-level flood risk scores that consider both historical flooding and future climate projections. The models they use identify risks for many properties that FEMA maps don’t, highlighting hidden vulnerabilities in communities across the United States.
Research shows that the availability, and accessibility, of climate data on these sites has started driving property-buying decisions that increasingly take climate change into account.
Implications for the future
As homebuyers understand more about a property’s flood risks, that may shift the desirability of some locations over time. Those shifts will have implications for property valuations, community tax-revenue assessments, population migration patterns and a slew of other considerations.
However, while these may feel like changes being brought on by new data, the risk was already there. What is changing is people’s awareness.
The federal government has an important role to play in ensuring that accurate risk assessments are available to communities and Americans everywhere. As better tools and models evolve for assessing risk evolve, FEMA’s risk maps need to evolve, too.