Storm-chasing for science can be exciting and stressful – we know, because we do it. It has also been essential for developing today’s understanding of how tornadoes form and how they behave.
In 1996 the movie “Twister” brought storm-chasing into the public imagination as scientists played by Helen Hunt and Bill Paxton raced ahead of tornadoes to deploy their sensors and occasionally got too close. That movie inspired a generation of atmospheric scientists.
With the new movie “Twisters” coming out on July 19, 2024, we’ve been getting questions about storm-chasing – or storm intercepts, as we call them.
Here are some answers about what scientists who do this kind of fieldwork are up to when they race off after storms.
Scientists with the National Severe Storms Lab ‘intercepted’ this tornado to collect data using mobile radar and other instruments on May 24, 2024. National Severe Storms Lab
What does a day of storm-chasing really look like?
The morning of a chase day starts with a good breakfast, because there might not be any chance to eat a good meal later in the day.
Our goal is to figure out where tornadoes are most likely to occur that day. Temperature, moisture and winds, and how these change with height above the ground, all provide clues.
There is a “hurry up and wait” cadence to a storm chase day. We want to get into position quickly, but then we’re often waiting for storms to develop.
A ‘hook echo’ on radar, typically a curl at the back of a storm cell, is one sign that a tornado could form. The hook reflects precipitation wrapping around the back side of the updraft. National Severe Storms Lab
Storms often take time to develop before they’re capable of producing tornadoes. So we watch the storm carefully on radar and with our eyes, if possible, staying well ahead of it until it matures. Often, we’ll watch multiple storms and look for signs that one might be more likely to generate tornadoes.
Once the mission scientist declares a deployment, everyone scrambles to get into position.
We use a lot of different instruments to track and measure tornadoes, and there is an art to determining when to deploy them. Too early, and the tornado might not form where the instruments are. Too late, and we’ve missed it. Each instrument needs to be in a specific location relative to the tornado. Some need to be deployed well ahead of the storm and then stay stationary. Others are car-mounted and are driven back and forth within the storm.
Vehicle-mounted equipment can act as mobile weather stations known as mesonets. These were used in the VORTEX2 research project. Dozens of scientists, including the authors, succeeded in recording the entire life cycle of a supercell tornado during VORTEX2 in 2009. Yvette Richardson
If all goes well, team members will be concentrating on the data coming in. Some will be launching weather balloons at various distances from the tornado, while others will be placing “pods” containing weather instruments directly in the path of the tornado.
A whole network of observing stations will have been set up across the storm, with radars collecting data from multiple angles, photographers capturing the storm from multiple angles, and instrumented vehicles transecting key areas of the storm.
Not all of our work is focused on the tornado itself. We often target areas around the tornado or within other parts of the storm to understand how the rotation forms. Theories suggest that this rotation can be generated by temperature variations within the storm’s precipitation region, potentially many miles from where the tornado forms.
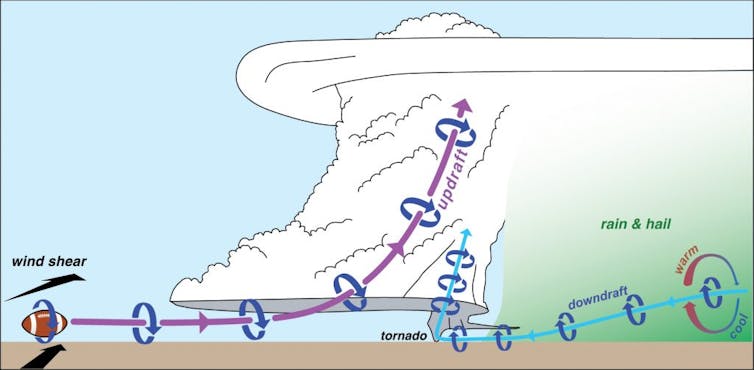
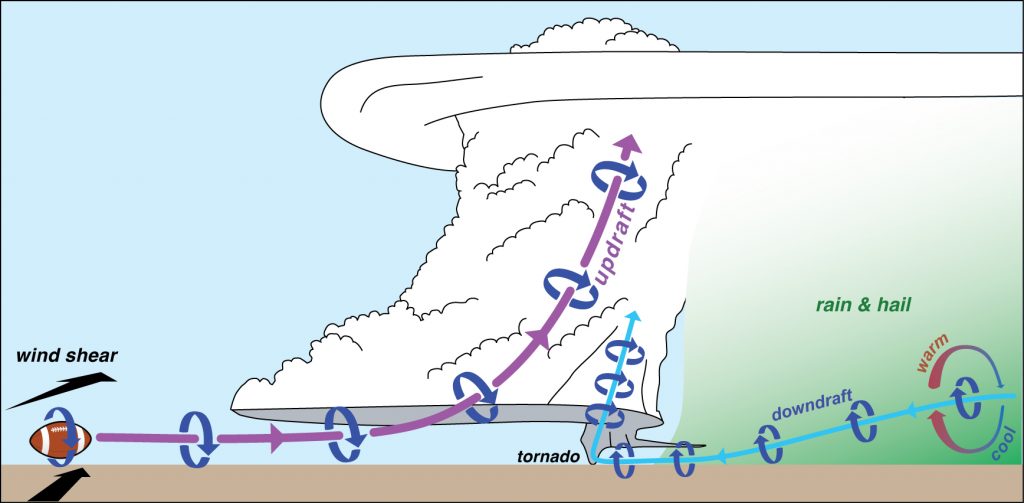
Formation of a tornado: Changes in wind speed and direction with altitude, known as wind shear, are associated with horizontal spin, similar to that of a football. As this spinning air is drawn into the storm’s updraft, the updraft rotates. A separate air stream descends through a precipitation-driven downdraft and acquires horizontal spin because of temperature differences along the air stream. This spinning air can be tilted into the vertical and sucked upward by the supercell’s updraft, contracting the spin near the ground into a tornado. Paul Markowski/Penn State
Through all of this, the teams stay in contact using text messages and software that allows us to see everyone’s position relative to the latest radar images. We’re also watching the forecast for the next day so we can plan where to go next and find hotel rooms and, hopefully, a late dinner.
What do all those instruments tell you about the storm?
One of the most important tools of storm-chasing is weather radar. It captures what’s happening with precipitation and winds above the ground.
We use several types of radars, typically attached to trucks so we can move fast. Some transmit with a longer wavelength that helps us see farther into a storm, but at the cost of a broader width to their beam, resulting in a fuzzier picture. They are good for collecting data across the entire storm.
Smaller-wavelength radars cannot penetrate as far into the precipitation, but they do offer the high-resolution view necessary to capture small-scale phenomena like tornadoes. We put these radars closer to the developing tornado.
An inside look at some of the mobile systems and tools scientists use in storm-chasing, including how team members monitor storms in real time.
We also monitor wind, air pressure, temperature and humidity along the ground using various instruments attached to moving vehicles, or by temporarily deploying stationary arrays of these instruments ahead of the approaching storm. Some of these are meant to be hit by the tornado.
Weather balloons provide crucial data, too. Some are designed to ascend through the atmosphere and capture the conditions outside the storm. Others travel through the storm itself, measuring the important temperature variations in the rain-cooled air beneath the storm. Scientists are now using drones in the same way in parts of the storm.
Symbols show the paths of over 70 balloon-borne probes that the authors’ team launched into a supercell thunderstorm. The probes, carried by the wind, mapped the temperature in the storm’s downdraft region, which can be a critical source of rotation for tornadoes. Luke LeBel/Penn State
All of this gives scientists insight into the processes happening throughout the storm before and during tornado development and throughout the tornado’s lifetime.
How do you stay safe while chasing tornadoes?
Storms can be very dangerous and unpredictable, so it’s important to always stay on top of the radar and watch the storm.
A storm can cycle, developing a new tornado downstream of the previous one. Tornadoes can change direction, particularly as they are dying or when they have a complex structure with multiple funnels. Storm chasers know to look at the entire storm, not just the tornado, and to be on alert for other storms that might sneak up. An escape plan based on the storm’s expected motion and the road network is essential.
In 1947, the Thunderstorm Project was the first large-scale U.S. scientific study of thunderstorms and the first to use radar and airplanes. Other iconic projects followed, including ones that deployed a Totable Tornado Observatory, or Toto, which inspired the ‘Dorothy’ instrument in the movie ‘Twister.’
Scientists take calculated risks when they’re storm chasing – enough to collect crucial data, but never putting their teams in too much danger.
It turns out that driving is actually the most dangerous part of storm-chasing, particularly when roads are wet and visibility is poor – as is often the case at the end of the day. During the chase, the driving danger can be compounded by erratic driving of other storm chasers and traffic jams around storms.
What happens to all the data you collect while storm-chasing?
It would be nice to have immediate eureka moments, but the results take time.
After we collect the data, we spend years analyzing it. Combining data from all the instruments to get a complete picture of the storm and how it evolved takes time and patience. But having data on the wind, temperature, relative humidity and pressure from many different angles and instruments allows us to test theories about how tornadoes develop.
Although the analysis process is slow, the discoveries are often as exciting as the tornado itself.
theconversation.com – Dawn Rogala, Paintings Conservator and Program Manager, Smithsonian Institution – 2025-09-08 07:07:00
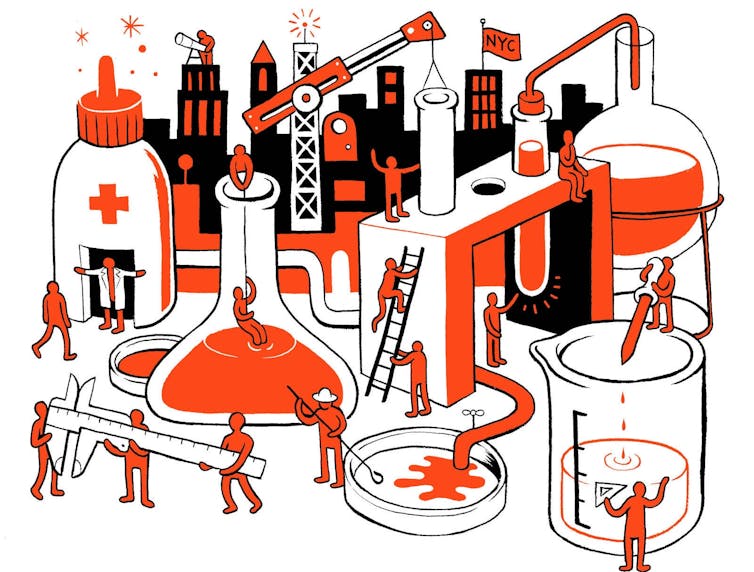
Paint is made by mixing pigments—colorful substances found in rocks, plants, insects, or made synthetically—with binders that help spread and hold the color on surfaces. Traditionally, artists combined pigments with natural materials like water or oil, while modern factories produce large quantities with synthetic additives for durability. The paint’s ingredients depend on who uses it, its purpose, application method, and environment. Beyond art, paints protect objects like houses and cars. Smithsonian conservators study painted artifacts to learn about history using techniques like X-rays and 3D scans, helping preserve cultural heritage and uncovering stories behind materials and methods.
Protective paint sprayed onto a steel plate in a factory will have a different recipe than paint used in an art class. gilaxia/E+ via Getty Images
How is paint made? – Atharva, age 11, Bengaluru, India
Did you ever mix dirt and water when you were playing outside? You made a paint. Did you draw shapes on the ground with your muddy hands? You made a painting.
Paint is made by combining a colorful substance – a pigment – with another material that binds the color together and helps spread that color onto surfaces such as paper, fabric or wood. Pigments can be found everywhere – in rocks and minerals, plants or insects. Some colors are made by scientists in laboratories.
Long ago, artists made their own paints by mixing pigments with natural materials such as water, oil or egg yolk to hold the colors together in a paste. Artists today can still make their own paints, or they can order them from factories that mix, package and ship paint all over the world. Paint companies use large, industrial machines to grind pigments and binders together; these commercial paints include synthetic materials and preservatives to control the paint’s behavior and to help paint last longer in tubes or cans.
Paints and coatings do many jobs beyond just coloring paper in an artist’s studio. They are also used as protective coatings to shield houses and cars from the sun or the cold, or as a barrier between boats and the water that surrounds their wood, metal or plastic parts. Where and how a paint will be used influence how it’s made and with what ingredients.
How will the paint be applied?By brush, by spray, or some other way?
Where and when will the paint be used? Does it need to dry quickly or slowly? Will the painted surface get really cold or hot? Is the paint safe for kids to use at home or school?
What should the paint look like? Should the dried paint be shiny or matte? Should the surface be lumpy, or should it flatten and level out? Should the colors be bright or dull? Should the paint layers be opaque, transparent or almost clear? Does the paint need to hold up against scuffs and stains?
There are many different companies that design and make the wide range of paints used around the world for all these various applications. Experts at each manufacturer understand their special type of paint, how the paint materials are measured and mixed, and the best ways to store and apply the paint. A single factory can make tens of thousands of gallons of paint each day, and paint companies produce millions of tubes of paint every year.
Art conservators and conservation scientists likeuswork together to study and preserve cultural heritage such as paintings and painted objects. Studying paint helps us learn about the past and protect this history for future generations.
The paint colors used on large, traditional Indian paintings called “pichwai,” for example, include pigments gathered from around the world. They can reveal information about ancient manufacturing and how communities that lived far apart exchanged goods and knowledge.
There are many techniques to investigate artwork, from looking at small pieces of paint under a microscope to using more complicated equipment to analyze materials exposed to different types of energy. For example, we can use X-ray, infrared or ultraviolet imaging to identify different pigments in a painting.
Research on an Alaskan Tlingit crest hat made in the 1800s looked at the molecules in paint binders, combined with 3D scanning, to help clan members replicate the hat for ceremonial use.
Unusual uses bring conservation challenges
Artists use all sorts of materials in their artwork that were designed for other purposes. Some 19th- and early 20th-century sculptures were painted with laundry bluing – a material that used blue pigment to brighten clothes during washing. In the 1950s, artists started using thin, quick-drying house paint in their paintings.
When paints are used in a way that was not part of their design, strange things can happen. Paints made to be applied in thin layers but instead are used in thick layers can wrinkle and pucker as they dry. Paints designed to stick to rough wood can curl or lift away from slick surfaces. The colors and ingredients in paint can also fade or darken over time. Some artists want these different effects in their artwork; some artists are surprised when paints don’t behave the way they expected.
Art conservators and conservation scientists use information about artists and their paints to understand why artworks are faded, broken or acting in surprising ways, and they use that knowledge to slow or stop the damage. We can even clean some kinds of damage with lasers.
The more we know about paint, the more we learn about the past lives of painted objects and how to keep those objects around for a long, long time.
Hello, curious kids! Do you have a question you’d like an expert to answer? Ask an adult to send your question to CuriousKidsUS@theconversation.com. Please tell us your name, age and the city where you live.
And since curiosity has no age limit – adults, let us know what you’re wondering, too. We won’t be able to answer every question, but we will do our best.
Note: The following A.I. based commentary is not part of the original article, reproduced above, but is offered in the hopes that it will promote greater media literacy and critical thinking, by making any potential bias more visible to the reader –Staff Editor.
Political Bias Rating: Centrist
The content is an educational piece explaining how paint is made and used, with no evident political agenda or bias. It focuses on scientific, historical, and artistic aspects in a neutral and informative manner, suitable for a general audience including children. There is no indication of leaning toward any political ideology or partisan perspective.
theconversation.com – Sara Giordano, Associate Professor of Interdisciplinary Studies, Kennesaw State University – 2025-09-04 07:53:00
The article explores the myth of scientific objectivity, showing how science is deeply intertwined with cultural values and social context. It challenges traditional views, such as the passive egg and active sperm narrative, revealing that scientific knowledge often reflects societal norms. Science emerged as a quest for objectivity within Western universities over centuries, but the strict division between subjective humanities and objective sciences is arbitrary and hierarchical. Scientists, being cultural beings, influence research choices and interpretations unconsciously. Contemporary controversies, like vaccine debates, highlight the impossibility of bias-free science. Instead, democratic, collaborative processes are advocated to align research with societal values, fostering more honest and inclusive scientific inquiry.
Even if you don’t recall many facts from high school biology, you likely remember the cells required for making babies: egg and sperm. Maybe you can picture a swarm of sperm cells battling each other in a race to be the first to penetrate the egg.
For decades, scientific literature described human conception this way, with the cells mirroring the perceived roles of women and men in society. The egg was thought to be passive while the sperm was active.
The opening credits of the 1989 movie ‘Look Who’s Talking’ animated this popular narrative, with speaking sperm rushing toward the nonverbal egg to be the first to fertilize it.
Over time, scientists realized that sperm are too weak to penetrate the egg and that the union is more mutual, with the two cells working together. It’s no coincidence that these findings were made in the same era when new cultural ideas of more egalitarian gender roles were taking hold.
Scientist Ludwik Fleck is credited with first describing science as a cultural practice in the 1930s. Since then, understanding has continued to build that scientific knowledge is always consistent with the cultural norms of its time.
Despite these insights, across political differences, people strive for and continue to demand scientific objectivity: the idea that science should be unbiased, rational and separable from cultural values and beliefs.
When I entered my Ph.D. program in neuroscience in 2001, I felt the same way. But reading a book by biologist Anne Fausto-Sterling called “Sexing the Body” set me down a different path. It systematically debunked the idea of scientific objectivity, showing how cultural ideas about sex, gender and sexuality were inseparable from the scientific findings. By the time I earned my Ph.D., I began to look more holistically at my research, integrating the social, historical and political context.
From the questions scientists begin with, to the beliefs of the people who conduct the research, to choices in research design, to interpretation of the final results, cultural ideas constantly inform “the science.” What if an unbiased science is impossible?
Emergence of idea of scientific objectivity
Science grew to be synonymous with objectivity in the Western university system only over the past few hundred years.
In the 15th and 16th centuries, some Europeans gained traction in challenging the religiously ordained royal order. Consolidation of the university system led to shifts from trust in religious leaders interpreting the word of “god,” to trust in “man” making one’s own rational decisions, to trust in scientists interpreting “nature.” The university system became an important site for legitimizing claims through theories and studies.
Previously, people created knowledge about their world, but there were not strict boundaries between what are now called the humanities, such as history, English and philosophy, and the sciences, including biology, chemistry and physics. Over time, as questions arose about how to trust political decisions, people split the disciplines into categories: subjective versus objective. The splitting came with the creation of other binary oppositions, including the closely related emotionality/rationality divide. These categories were not simply seen as opposite, but in a hierarchy with objectivity and rationality as superior.
A closer look shows that these binary systems are arbitrary and self-reinforcing.
Science is a human endeavor
The sciences are fields of study conducted by humans. These people, called scientists, are part of cultural systems just like everyone else. We scientists are part of families and have political viewpoints. We watch the same movies and TV shows and listen to the same music as nonscientists. We read the same newspapers, cheer for the same sports teams and enjoy the same hobbies as others.
All of these obviously “cultural” parts of our lives are going to affect how scientists approach our jobs and what we consider “common sense” that does not get questioned when we do our experiments.
For example, in my Ph.D. work in neuroscience, I saw how different assumptions about hierarchy could influence specific experiments and even the entire field. Neuroscience focuses on what is called the central nervous system. The name itself describes a hierarchical model, with one part of the body “in charge” of the rest. Even within the central nervous system, there was a conceptual hierarchy with the brain controlling the spinal cord.
My research looked more at what happened peripherally in muscles, but the predominant model had the brain at the top. The taken-for-granted idea that a system needs a boss mirrors cultural assumptions. But I realized we could have analyzed the system differently and asked different questions. Instead of the brain being at the top, a different model could focus on how the entire system communicates and works together at coordination.
Every experiment also has assumptions baked in – things that are taken for granted, including definitions. Scientific experiments can become self-fulfilling prophecies.
For example, billions of dollars have been spent on trying to delineate sex differences. However, the definition of male and female is almost never stated in these research papers. At the same time, evidence mounts that these binary categories are a modern inventionnot based on clear physical differences.
But the categories are tested so many times that eventually some differences are discovered without putting these results into a statistical model together. Oftentimes, so-called negative findings that don’t identify a significant difference are not even reported. Sometimes, meta-analyses based on multiple studies that investigated the same question reveal these statistical errors, as in the search for sex-related brain differences. Similar patterns of slippery definitions that end up reinforcing taken-for-granted assumptions happen withrace, sexuality and other socially created categories of difference.
Finally, the end results of experiments can be interpreted in many different ways, adding another point where cultural values are injected into the final scientific conclusions.
Settling on science when there’s no objectivity
Vaccines. Abortion. Climate change. Sex categories. Science is at the center of most of today’s hottest political debates. While there is much disagreement, the desire to separate politics and science seems to be shared. On both sides of the political divide, there are accusations that the other side’s scientists cannot be trusted because of political bias.
It can be easier to spot built-in bias in scientific perspectives that conflict with your own values. Jim Watson/AFP via Getty Images
Consider the recent controversy over the U.S. Centers for Disease Control and Prevention’s vaccine advisory panel. Secretary of Health and Human Services Robert F. Kennedy Jr. fired all members of the Advisory Committee on Immunization Practices, saying they were biased, while some Democratic lawmakers argued back that his move put in place those who would be biased in pushing his vaccine-skeptical agenda.
If removing all bias is impossible, then, how do people create knowledge that can be trusted?
The understanding that all knowledge is created through cultural processes does allow for two or more differing truths to coexist. You see this reality in action around many of today’s most controversial subjects. However, this does not mean you must believe all truths equally – that’s called total cultural relativism. This perspective ignores the need for people to come to decisions together about truth and reality.
Instead, critical scholars offer democratic processes for people to determine which values are important and for what purposes knowledge should be developed. For example, some of my work has focused on expanding a 1970s Dutch model of the science shop, where community groups come to university settings to share their concerns and needs to help determine research agendas. Other researchers have documented other collaborative practices between scientists and marginalized communities or policy changes, including processes for more interdisciplinary or democratic input, or both.
I argue a more accurate view of science is that pure objectivity is impossible. Once you leave the myth of objectivity behind, though, the way forward is not simple. Instead of a belief in an all-knowing science, we are faced with the reality that humans are responsible for what is researched, how it is researched and what conclusions are drawn from such research.
With this knowledge, we have the opportunity to intentionally set societal values that inform scientific investigations. This requires decisions about how people come to agreements about these values. These agreements need not always be universal but instead can be dependent on the context of who and what a given study might affect. While not simple, using these insights, gained over decades of studying science from both within and outside, may force a more honest conversation between political positions.
Alternative views on the relationship between science and culture. Sara Giordano
Science is a human endeavor
The sciences are fields of study conducted by humans. These people, called scientists, are part of cultural systems just like everyone else. We scientists are part of families and have political viewpoints. We watch the same movies and TV shows and listen to the same music as nonscientists. We read the same newspapers, cheer for the same sports teams and enjoy the same hobbies as others.
All of these obviously “cultural” parts of our lives are going to affect how scientists approach our jobs and what we consider “common sense” that does not get questioned when we do our experiments.
For example, in my Ph.D. work in neuroscience, I saw how different assumptions about hierarchy could influence specific experiments and even the entire field. Neuroscience focuses on what is called the central nervous system. The name itself describes a hierarchical model, with one part of the body “in charge” of the rest. Even within the central nervous system, there was a conceptual hierarchy with the brain controlling the spinal cord.
My research looked more at what happened peripherally in muscles, but the predominant model had the brain at the top. The taken-for-granted idea that a system needs a boss mirrors cultural assumptions. But I realized we could have analyzed the system differently and asked different questions. Instead of the brain being at the top, a different model could focus on how the entire system communicates and works together at coordination.
Every experiment also has assumptions baked in – things that are taken for granted, including definitions. Scientific experiments can become self-fulfilling prophecies.
For example, billions of dollars have been spent on trying to delineate sex differences. However, the definition of male and female is almost never stated in these research papers. At the same time, evidence mounts that these binary categories are a modern inventionnot based on clear physical differences.
But the categories are tested so many times that eventually some differences are discovered without putting these results into a statistical model together. Oftentimes, so-called negative findings that don’t identify a significant difference are not even reported. Sometimes, meta-analyses based on multiple studies that investigated the same question reveal these statistical errors, as in the search for sex-related brain differences. Similar patterns of slippery definitions that end up reinforcing taken-for-granted assumptions happen withrace, sexuality and other socially created categories of difference.
Finally, the end results of experiments can be interpreted in many different ways, adding another point where cultural values are injected into the final scientific conclusions.
Settling on science when there’s no objectivity
Vaccines. Abortion. Climate change. Sex categories. Science is at the center of most of today’s hottest political debates. While there is much disagreement, the desire to separate politics and science seems to be shared. On both sides of the political divide, there are accusations that the other side’s scientists cannot be trusted because of political bias.
It can be easier to spot built-in bias in scientific perspectives that conflict with your own values. Jim Watson/AFP via Getty Images
Consider the recent controversy over the U.S. Centers for Disease Control and Prevention’s vaccine advisory panel. Secretary of Health and Human Services Robert F. Kennedy Jr. fired all members of the Advisory Committee on Immunization Practices, saying they were biased, while some Democratic lawmakers argued back that his move put in place those who would be biased in pushing his vaccine-skeptical agenda.
If removing all bias is impossible, then, how do people create knowledge that can be trusted?
The understanding that all knowledge is created through cultural processes does allow for two or more differing truths to coexist. You see this reality in action around many of today’s most controversial subjects. However, this does not mean you must believe all truths equally – that’s called total cultural relativism. This perspective ignores the need for people to come to decisions together about truth and reality.
Instead, critical scholars offer democratic processes for people to determine which values are important and for what purposes knowledge should be developed. For example, some of my work has focused on expanding a 1970s Dutch model of the science shop, where community groups come to university settings to share their concerns and needs to help determine research agendas. Other researchers have documented other collaborative practices between scientists and marginalized communities or policy changes, including processes for more interdisciplinary or democratic input, or both.
I argue a more accurate view of science is that pure objectivity is impossible. Once you leave the myth of objectivity behind, though, the way forward is not simple. Instead of a belief in an all-knowing science, we are faced with the reality that humans are responsible for what is researched, how it is researched and what conclusions are drawn from such research.
With this knowledge, we have the opportunity to intentionally set societal values that inform scientific investigations. This requires decisions about how people come to agreements about these values. These agreements need not always be universal but instead can be dependent on the context of who and what a given study might affect. While not simple, using these insights, gained over decades of studying science from both within and outside, may force a more honest conversation between political positions.
Note: The following A.I. based commentary is not part of the original article, reproduced above, but is offered in the hopes that it will promote greater media literacy and critical thinking, by making any potential bias more visible to the reader –Staff Editor.
Political Bias Rating: Center-Left
The content emphasizes the influence of cultural and social values on scientific research, challenging the notion of pure scientific objectivity. It highlights themes such as gender equality, critiques of traditional hierarchies, and the social construction of categories like sex and race, which are commonly associated with progressive or center-left perspectives. While it acknowledges political divides and calls for democratic, inclusive approaches to science, the overall framing aligns with a center-left viewpoint that values social context and equity in knowledge production.
theconversation.com – Paul Winters, Professor of Sustainable Development, University of Notre Dame – 2025-09-03 07:30:00
Climate change intensifies weather risks for farmers, affecting crop yields and incomes, especially in low- and middle-income countries lacking accurate forecasts due to costly traditional models. AI-powered weather forecasting offers a breakthrough by delivering accurate, localized predictions rapidly and inexpensively, using far less computational power than physics-based systems. Advanced AI models like Pangu-Weather and GraphCast now match or surpass traditional forecasts, enabling timely, high-resolution weather guidance on standard computers. To be effective, AI forecasts must be tailored to local agricultural needs and disseminated through accessible channels. Supported by organizations such as AIM for Scale, AI forecasting can empower developing countries to adapt farming practices and improve resilience amid climate change.
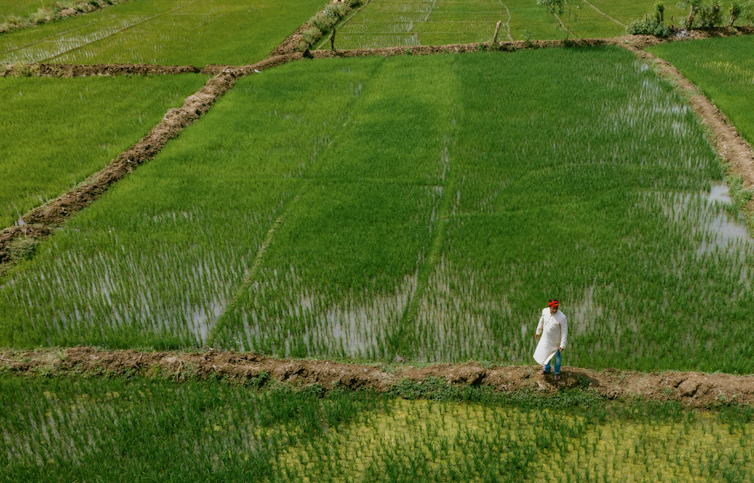
Weather forecasts help farmers figure out when to plant, where to use fertilizer and much more. Maitreya Shah/Studio India
For farmers, every planting decision carries risks, and many of those risks are increasing with climate change. One of the most consequential is weather, which can damage crop yields and livelihoods. A delayed monsoon, for example, can force a rice farmer in South Asia to replant or switch crops altogether, losing both time and income.
Access to reliable, timely weather forecasts can help farmers prepare for the weeks ahead, find the best time to plant or determine how much fertilizer will be needed, resulting in better crop yields and lower costs.
Yet, in many low- and middle-income countries, accurate weather forecasts remain out of reach, limited by the high technology costs and infrastructure demands of traditional forecasting models.
A new wave of AI-powered weather forecasting models has the potential to change that.
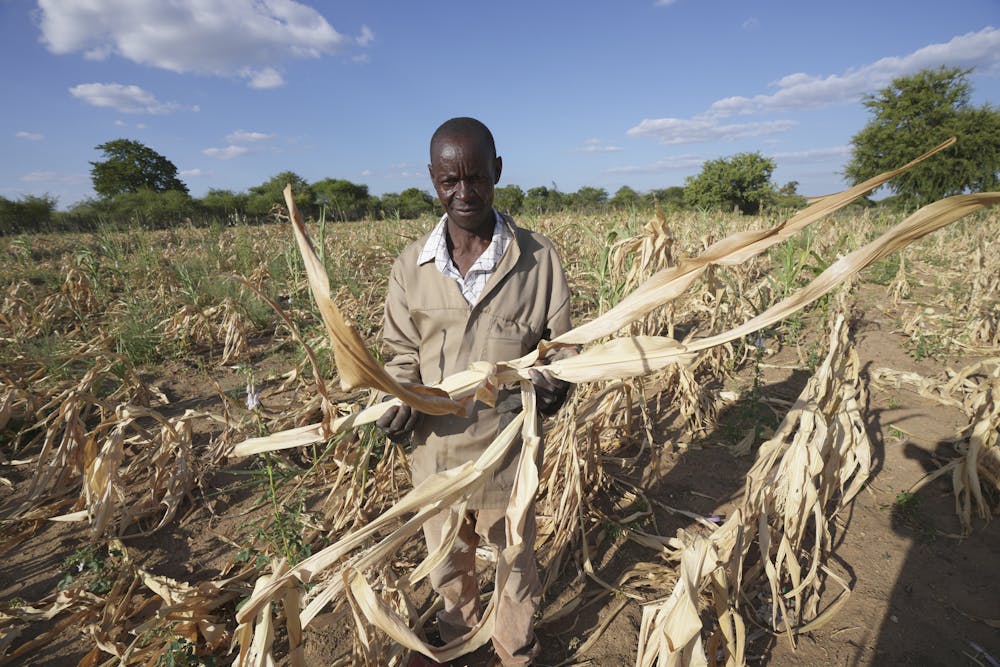
A farmer holds dried-up maize stalks in his field in Zimbabwe on March 22, 2024. A drought had caused widespread water shortages and crop failures. AP Photo/Tsvangirayi Mukwazhi
By using artificial intelligence, these models can deliver accurate, localized predictions at a fraction of the computational cost of conventional physics-based models. This makes it possible for national meteorological agencies in developing countries to provide farmers with the timely, localized information about changing rainfall patterns that the farmers need.
The challenge is getting this technology where it’s needed.
Why AI forecasting matters now
The physics-based weather prediction models used by major meteorological centers around the world are powerful but costly. They simulate atmospheric physics to forecast weather conditions ahead, but they require expensive computing infrastructure. The cost puts them out of reach for most developing countries.
Moreover, these models have mainly been developed by and optimized for northern countries. They tend to focus on temperate, high-income regions and pay less attention to the tropics, where many low- and middle-income countries are located.
A major shift in weather models began in 2022 as industry and university researchers developed deep learning models that could generate accurate short- and medium-range forecasts for locations around the globe up to two weeks ahead.
These models worked at speeds several orders of magnitude faster than physics-based models, and they could run on laptops instead of supercomputers. Newer models, such as Pangu-Weather and GraphCast, have matched or even outperformed leading physics-based systems for some predictions, such as temperature.
AI-driven models require dramatically less computing power than the traditional systems.
While physics-based systems may need thousands of CPU hours to run a single forecast cycle, modern AI models can do so using a single GPU in minutes once the model has been trained. This is because the intensive part of the AI model training, which learns relationships in the climate from data, can use those learned relationships to produce a forecast without further extensive computation – that’s a major shortcut. In contrast, the physics-based models need to calculate the physics for each variable in each place and time for every forecast produced.
While training these models from physics-based model data does require significant upfront investment, once the AI is trained, the model can generate large ensemble forecasts — sets of multiple forecast runs — at a fraction of the computational cost of physics-based models.
Even the expensive step of training an AI weather model shows considerable computational savings. One study found the early model FourCastNet could be trained in about an hour on a supercomputer. That made its time to presenting a forecast thousands of times faster than state-of-the-art, physics-based models.
The result of all these advances: high-resolution forecasts globally within seconds on a single laptop or desktop computer.
While AI weather models offer impressive technical capabilities, they are not plug-and-play solutions. Their impact depends on how well they are calibrated to local weather, benchmarked against real-world agricultural conditions, and aligned with the actual decisions farmers need to make, such as what and when to plant, or when drought is likely.
To unlock its full potential, AI forecasting must be connected to the people whose decisions it’s meant to guide.
That’s why groups such as AIM for Scale, a collaboration we work with as researchers in public policy and sustainability, are helping governments to develop AI tools that meet real-world needs, including training users and tailoring forecasts to farmers’ needs. International development institutions and the World Meteorological Organization are also working to expand access to AI forecasting models in low- and middle-income countries.
Many low-income countries in Africa face harsh effects from climate change, from severe droughts to unpredictable rain and flooding. The shocks worsen conflict and upend livelihoods. AP Photo/Sunday Alamba
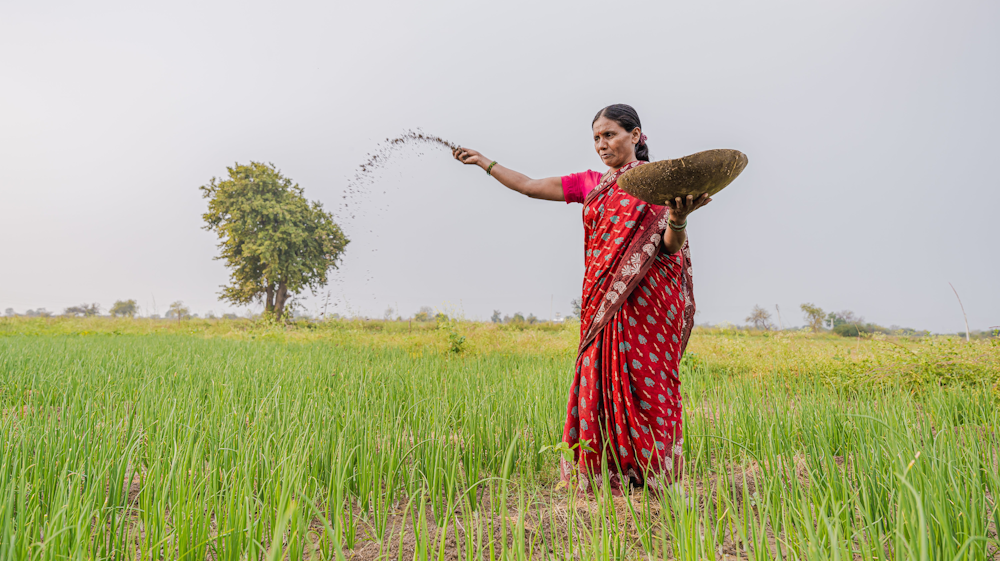
AI forecasts can be tailored to context-specific agricultural needs, such as identifying optimal planting windows, predicting dry spells or planning pest management. Disseminating those forecasts through text messages, radio, extension agents or mobile apps can then help reach farmers who can benefit. This is especially true when the messages themselves are constantly tested and improved to ensure they meet the farmers’ needs.
A recent study in India found that when farmers there received more accurate monsoon forecasts, they made more informed decisions about what and how much to plant – or whether to plant at all – resulting in better investment outcomes and reduced risk.
A new era in climate adaptation
AI weather forecasting has reached a pivotal moment. Tools that were experimental just five years ago are now being integrated into government weather forecasting systems. But technology alone won’t change lives.
With support, low- and middle-income countries can build the capacity to generate, evaluate and act on their own forecasts, providing valuable information to farmers that has long been missing in weather services.
A farmer holds dried-up maize stalks in his field in Zimbabwe on March 22, 2024. A drought had caused widespread water shortages and crop failures. AP Photo/Tsvangirayi Mukwazhi
By using artificial intelligence, these models can deliver accurate, localized predictions at a fraction of the computational cost of conventional physics-based models. This makes it possible for national meteorological agencies in developing countries to provide farmers with the timely, localized information about changing rainfall patterns that the farmers need.
The challenge is getting this technology where it’s needed.
Why AI forecasting matters now
The physics-based weather prediction models used by major meteorological centers around the world are powerful but costly. They simulate atmospheric physics to forecast weather conditions ahead, but they require expensive computing infrastructure. The cost puts them out of reach for most developing countries.
Moreover, these models have mainly been developed by and optimized for northern countries. They tend to focus on temperate, high-income regions and pay less attention to the tropics, where many low- and middle-income countries are located.
A major shift in weather models began in 2022 as industry and university researchers developed deep learning models that could generate accurate short- and medium-range forecasts for locations around the globe up to two weeks ahead.
These models worked at speeds several orders of magnitude faster than physics-based models, and they could run on laptops instead of supercomputers. Newer models, such as Pangu-Weather and GraphCast, have matched or even outperformed leading physics-based systems for some predictions, such as temperature.
AI-driven models require dramatically less computing power than the traditional systems.
While physics-based systems may need thousands of CPU hours to run a single forecast cycle, modern AI models can do so using a single GPU in minutes once the model has been trained. This is because the intensive part of the AI model training, which learns relationships in the climate from data, can use those learned relationships to produce a forecast without further extensive computation – that’s a major shortcut. In contrast, the physics-based models need to calculate the physics for each variable in each place and time for every forecast produced.
While training these models from physics-based model data does require significant upfront investment, once the AI is trained, the model can generate large ensemble forecasts — sets of multiple forecast runs — at a fraction of the computational cost of physics-based models.
Even the expensive step of training an AI weather model shows considerable computational savings. One study found the early model FourCastNet could be trained in about an hour on a supercomputer. That made its time to presenting a forecast thousands of times faster than state-of-the-art, physics-based models.
The result of all these advances: high-resolution forecasts globally within seconds on a single laptop or desktop computer.
While AI weather models offer impressive technical capabilities, they are not plug-and-play solutions. Their impact depends on how well they are calibrated to local weather, benchmarked against real-world agricultural conditions, and aligned with the actual decisions farmers need to make, such as what and when to plant, or when drought is likely.
To unlock its full potential, AI forecasting must be connected to the people whose decisions it’s meant to guide.
That’s why groups such as AIM for Scale, a collaboration we work with as researchers in public policy and sustainability, are helping governments to develop AI tools that meet real-world needs, including training users and tailoring forecasts to farmers’ needs. International development institutions and the World Meteorological Organization are also working to expand access to AI forecasting models in low- and middle-income countries.
Many low-income countries in Africa face harsh effects from climate change, from severe droughts to unpredictable rain and flooding. The shocks worsen conflict and upend livelihoods. AP Photo/Sunday Alamba
AI forecasts can be tailored to context-specific agricultural needs, such as identifying optimal planting windows, predicting dry spells or planning pest management. Disseminating those forecasts through text messages, radio, extension agents or mobile apps can then help reach farmers who can benefit. This is especially true when the messages themselves are constantly tested and improved to ensure they meet the farmers’ needs.
A recent study in India found that when farmers there received more accurate monsoon forecasts, they made more informed decisions about what and how much to plant – or whether to plant at all – resulting in better investment outcomes and reduced risk.
A new era in climate adaptation
AI weather forecasting has reached a pivotal moment. Tools that were experimental just five years ago are now being integrated into government weather forecasting systems. But technology alone won’t change lives.
With support, low- and middle-income countries can build the capacity to generate, evaluate and act on their own forecasts, providing valuable information to farmers that has long been missing in weather services.
Note: The following A.I. based commentary is not part of the original article, reproduced above, but is offered in the hopes that it will promote greater media literacy and critical thinking, by making any potential bias more visible to the reader –Staff Editor.
Political Bias Rating: Centrist
The content presents a factual and balanced discussion on the use of AI in weather forecasting to aid farmers, particularly in low- and middle-income countries. It emphasizes technological innovation, international collaboration, and practical benefits without promoting a specific political ideology. The focus on climate change and development is handled in a neutral, solution-oriented manner, reflecting a centrist perspective that values science and global cooperation.


