Connect with us

The Conversation

Soaring wealth inequality has remade the map of American prosperity

Published

on

theconversation.com – Tom Kemeny, Associate Professor, Munk School of Global Affairs & Public Policy, University of Toronto – 2025-01-16 07:54:00

New data highlights an increasing wealth divide across the United States.
pick-uppath/Getty Images

Tom Kemeny, University of Toronto

One need only glance at headlines about Jeff Bezos, Elon Musk and other super-wealthy individuals to understand that wealth in America is increasingly concentrated in fewer and fewer hands. Inequality is sharply on the rise.

Until now, however, little has been known about where the richest households are located, which cities are the most unequal and how these trends have evolved.

In a new analysis I conducted with my colleagues, we reveal where wealth is most concentrated within and between communities, cities and states. The result is GEOWEALTH-US – the first data that tracks the geography of wealth in the United States and how it has changed since 1960.

The overall picture is worrying. The wealthiest cities in the U.S. are now almost seven times richer than the poorest regions, a disparity that has almost doubled since 1960. Meanwhile, especially in urban coastal areas, wealth has become highly concentrated in the hands of a few. The picture from the geography of wealth suggests we are even more divided than we thought.

Mapping inequality

To measure wealth locally, we built precise models of household wealth, applying sophisticated machine learning techniques to data from the Federal Reserve’s survey of consumer finances.

We then used the models to estimate wealth among households in the decennial census and American community survey, where we can identify where people live.

Experts define wealth as the difference between the value of a household’s assets – cash, real estate and stocks, for example – and its liabilities, including mortgages, student loans and credit card debt. Wealth is also called “net worth.”

Using GEOWEALTH-US, we show that the wealth distribution across the U.S. has transformed since 1960. Inequality between the nation’s flourishing urban centers and other areas of the country, especially in parts of the South and Midwest, is higher than it has ever been over the previous 60 years.

The expansion of wealth inequality is a challenge to the American Dream: the notion that, with hard work, opportunity and prosperity are accessible to all.

Wealth enables choice and stability. Poorer households have more trouble providing the best nutrition and education for their children. Additionally, people growing up in lower-wealth households are less likely to spur innovation in a field or start successful new businesses. Wealth also profoundly affects one’s health, leaving the least wealthy in our society significantly more vulnerable to premature death and disability.

Large wealth gaps between places

We analyzed average household wealth across the U.S. between 1960 and 2022, using census-defined communities of about 100,000 residents.

At the community level, the lack of wealth can make a major difference in how well cities work for their residents.

People who grow up in wealthier places can reap benefits that span generations. As a result of property taxes and philanthropy, wealthier communities have greater resources for schools, health care, transportation and other infrastructure.

Good schools are one benefit of wealthy communities that may improve social mobility even for children born into poverty, studies suggest.

The map for 2022 reveals major disparities in typical (median) net worth across communities. Many of the least wealthy locations are in poor neighborhoods in some of America’s biggest cities – for instance, parts of the Bronx and East Harlem in New York, and areas of Houston and Milwaukee. A typical household in the five poorest communities had assets worth about $18,000. Many households in these locations held more debt than assets. Other wealth-poor areas of the country included parts of Baton Rouge, Louisiana, and Cincinnati, Ohio.

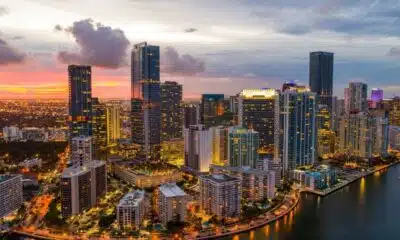
The wealthiest communities today tend to be found in urban coastal areas.

Palo Alto, California, and Nassau County, New York, are two of the nation’s five wealthiest places. The top five areas had median household net worth of nearly $1.7 million. That’s almost 90 times wealthier than the poorest five places.

These wealth divides help explain why, between 2019 and 2021, according to the school finance indicators database, the Palo Alto Unified School District in California spent about $7,000 more per student than the minimum required to achieve national benchmark test scores. Meanwhile, the East Baton Rouge school district spent almost $4,000 less per student than is required to meet those same national standards. Cincinnati Public Schools underspent by more than $9,000 per pupil.

Large wealth gaps within places

We also looked at wealth divides in cities and communities. Average wealth levels in a community matter, but so does their unequal distribution.

Inequality, especially when a community is racially diverse and spatially segregated, has been linked to underinvestment in public goods such as schools, roads and hospitals.

Our research identified large gaps in wealth within communities.

For example, in certain parts of California such as San Jose and Santa Monica, we found that the richest 10% of residents are about seven times wealthier than the median household. In contrast, in many parts of Utah and Minnesota, the wealthiest 10% of households are only about three times wealthier than the median household.

Coastal areas, then, are not simply wealthier than the rest of the country; wealth in these places is also less equally shared.

We also found that wealth is unequally distributed across many parts of the South. This reflects the legacy of slavery, discrimination and uneven economic development over generations.

Regardless of geography, across America we found that the most unequal places were likely to have larger populations of African Americans, Hispanics and other people of color. In these locations, white households were overrepresented among the wealthiest. Households of color, meanwhile, generally had much lower net worth.

The map of wealth is changing

Extensive testing shows that our model estimates wealth with a high level of accuracy. And by mapping household wealth rather than household income, which is what researchers more commonly use to assess economic well-being, we found that place-based divides are much worse than previously believed.

Our data shows that wealth gaps between places have grown much more than income gaps since 1960. By 2020, gaps in average wealth levels were about 60% higher than equivalent income gaps.

This appears to be driven by the changing economic fortunes of cities.

Average wealth levels in the San Francisco Bay Area, Seattle, New York and Boston have risen dramatically as these areas have cemented their leadership in high-technology sectors and finance.

The loss of manufacturing jobs, meanwhile, destroyed wealth in many American communities. In 1960, the industrial hub of Cleveland, Ohio, had among the highest levels of average household wealth in the country, according to our data. In 2020, Cleveland ranked 466th out of the 722 areas in our study.

Within cities, we also observed a rise in wealth concentration. In the Minneapolis metropolitan area, for instance, the share of total wealth held by the richest 0.1% of households has almost tripled, from about 3% in 1960 to almost 9% by 2020. This means that, compared with the past, just a few families there now own a much larger piece of the pie.

Ladder to success becoming harder to climb

Multiple factors may explain the growing pooling of wealth. They include the rising concentration of high-paying jobs in major metro areas and the explosive growth in housing values in these high-performing cities.

Changing federal tax policies have also favored the affluent at the expense of regular Americans.

If such policies continue under the next Trump administration, the divided geography of wealth may well grow worse – with significant consequences for U.S. democracy.The Conversation

Tom Kemeny, Associate Professor, Munk School of Global Affairs & Public Policy, University of Toronto

This article is republished from The Conversation under a Creative Commons license. Read the original article.

Read More

The post Soaring wealth inequality has remade the map of American prosperity appeared first on theconversation.com

The Conversation

I’m a physician who has looked at hundreds of studies of vaccine safety, and here’s some of what RFK Jr. gets wrong

Published

on

theconversation.com – Jake Scott, Clinical Associate Professor of Infectious Diseases, Stanford University – 2025-06-26 07:31:00


Robert F. Kennedy Jr., since becoming Health and Human Services secretary, has made many false claims about vaccines, including exaggerating mandatory shots for children and alleging conflicts of interest among vaccine advisers. In reality, children receive about 30-32 required vaccine doses protecting against 10-12 diseases, far fewer than his claimed 92. Modern vaccines contain far fewer antigens and improved adjuvants, reducing immune burden. Controlled trials, including placebo comparisons, have tested all routine vaccines extensively. U.S. monitoring systems track vaccine safety continuously. Allegations of widespread conflicts of interest among advisers are unfounded, and vaccines have significantly reduced childhood illnesses and deaths.

Public health experts worry that factually inaccurate statements by Robert F. Kennedy Jr. threaten the public’s confidence in vaccines.
Andrew HarnikGetty Images

Jake Scott, Stanford University

In the four months since he began serving as secretary of the Department of Health and Human Services, Robert F. Kennedy Jr. has made many public statements about vaccines that have cast doubt on their safety and on the objectivity of long-standing processes established to evaluate them.

Many of these statements are factually incorrect. For example, in a newscast aired on June 12, 2025, Kennedy told Fox News viewers that 97% of federal vaccine advisers are on the take. In the same interview, he also claimed that children receive 92 mandatory shots. He has also widely claimed that only COVID-19 vaccines, not other vaccines in use by both children and adults, were ever tested against placebos and that “nobody has any idea” how safe routine immunizations are.

As an infectious disease physician who curates an open database of hundreds of controlled vaccine trials involving over 6 million participants, I am intimately familiar with the decades of research on vaccine safety. I believe it is important to correct the record – especially because these statements come from the official who now oversees the agencies charged with protecting Americans’ health.

Do children really receive 92 mandatory shots?

In 1986, the childhood vaccine schedule contained about 11 doses protecting against seven diseases. Today, it includes roughly 50 injections covering 16 diseases. State school entry laws typically require 30 to 32 shots across 10 to 12 diseases. No state mandates COVID-19 vaccination. Where Kennedy’s “92 mandatory shots” figure comes from is unclear, but the actual number is significantly lower.

From a safety standpoint, the more important question is whether today’s schedule with additional vaccines might be too taxing for children’s immune systems. It isn’t, because as vaccine technology improved over the past several decades, the number of antigens in each vaccine dose is much lower than before.

Antigens are the molecules in vaccines that trigger a response from the immune system, training it to identify the specific pathogen. Some vaccines contain a minute amount of aluminum salt that serves as an adjuvant – a helper ingredient that improves the quality and staying power of the immune response, so each dose can protect with less antigen.

Those 11 doses in 1986 delivered more than 3,000 antigens and 1.5 milligrams of aluminum over 18 years. Today’s complete schedule delivers roughly 165 antigens – which is a 95% reduction – and 5-6 milligrams of aluminum in the same time frame. A single smallpox inoculation in 1900 exposed a child to more antigens than today’s complete series.

A black-and-white photo of a doctor in a white coat giving an injection to a boy who is held by a female nurse.
Jonas Salk, the inventor of the polio vaccine, administers a dose to a boy in 1954.
Underwood Archives via Getty Images

Since 1986, the United States has introduced vaccines against Haemophilus influenzae type b, hepatitis A and B, chickenpox, pneumococcal disease, rotavirus and human papillomavirus. Each addition represents a life-saving advance.

The incidence of Haemophilus influenzae type b, a bacterial infection that can cause pneumonia, meningitis and other severe diseases, has dropped by 99% in infants. Pediatric hepatitis infections are down more than 90%, and chickenpox hospitalizations are down about 90%. The Centers for Disease Control and Prevention estimates that vaccinating children born from 1994 to 2023 will avert 508 million illnesses and 1,129,000 premature deaths.

Placebo testing for vaccines

Kennedy has asserted that only COVID-19 vaccines have undergone rigorous safety trials in which they were tested against placebos. This is categorically wrong.

Of the 378 controlled trials in our database, 195 compared volunteers’ response to a vaccine with their response to a placebo. Of those, 159 gave volunteers only a salt water solution or another inert substance. Another 36 gave them just the adjuvant without any viral or bacterial material, as a way to see whether there were side effects from the antigen itself or the injection. Every routine childhood vaccine antigen appears in at least one such study.

The 1954 Salk polio trial, one of the largest clinical trials in medical history, enrolled more than 600,000 children and tested the vaccine by comparing it with a salt water control. Similar trials, which used a substance that has no biological effect as a control, were used to test Haemophilus influenzae type b, pneumococcal, rotavirus, influenza and HPV vaccines.

Once an effective vaccine exists, ethics boards require new versions be compared against that licensed standard because withholding proven protection from children would be unethical.

How unknown is the safety of widely used vaccines?

Kennedy has insisted on multiple occasions that “nobody has any idea” about vaccine safety profiles. Of the 378 trials in our database, the vast majority published detailed safety outcomes.

Beyond trials, the U.S. operates the Vaccine Adverse Event Reporting System, the Vaccine Safety Datalink and the PRISM network to monitor hundreds of millions of doses for rare problems. The Vaccine Adverse Event Reporting System works like an open mailbox where anyone – patients, parents, clinicians – can report a post-shot problem; the Vaccine Safety Datalink analyzes anonymized electronic health records from large health care systems to spot patterns; and PRISM scans billions of insurance claims in near-real time to confirm or rule out rare safety signals.

These systems led health officials to pull the first rotavirus vaccine in 1999 after it was linked to bowel obstruction, and to restrict the Johnson & Johnson COVID-19 vaccine in 2021 after rare clotting events. Few drug classes undergo such continuous surveillance and are subject to such swift corrective action when genuine risks emerge.

The conflicts of interest claim

On June 9, Kennedy took the unprecedented step of dissolving vetted members of the Advisory Committee on Immunization Practices, the expert body that advises the CDC on national vaccine policy. He has claimed repeatedly that the vast majority of serving members of the committee – 97% – had extensive conflicts of interest because of their entanglements with the pharmaceutical industry. Kennedy bases that number on a 2009 federal audit of conflict-of-interest paperwork, but that report looked at 17 CDC advisory committees, not specifically this vaccine committee. And it found no pervasive wrongdoing – 97% of disclosure forms only contained routine paperwork mistakes, such as information in the wrong box or a missing initial, and not hidden financial ties.

Reuters examined data from Open Payments, a government website that discloses health care providers’ relationships with industry, for all 17 voting members of the committee who were dismissed. Six received no more than US$80 from drugmakers over seven years, and four had no payments at all.

The remaining seven members accepted between $4,000 and $55,000 over seven years, mostly for modest consulting or travel. In other words, just 41% of the committee received anything more than pocket change from drugmakers. Committee members must divest vaccine company stock and recuse themselves from votes involving conflicts.

A term without a meaning

Kennedy has warned that vaccines cause “immune deregulation,” a term that has no basis in immunology. Vaccines train the immune system, and the diseases they prevent are the real threats to immune function.

Measles can wipe immune memory, leaving children vulnerable to other infections for years. COVID-19 can trigger multisystem inflammatory syndrome in children. Chronic hepatitis B can cause immune-mediated organ damage. Preventing these conditions protects people from immune system damage.

Today’s vaccine panel doesn’t just prevent infections; it deters doctor visits and thereby reduces unnecessary prescriptions for “just-in-case” antibiotics. It’s one of the rare places in medicine where physicians like me now do more good with less biological burden than we did 40 years ago.

The evidence is clear and publicly available: Vaccines have dramatically reduced childhood illness, disability and death on a historic scale.The Conversation

Jake Scott, Clinical Associate Professor of Infectious Diseases, Stanford University

This article is republished from The Conversation under a Creative Commons license. Read the original article.

Read More

The post I’m a physician who has looked at hundreds of studies of vaccine safety, and here’s some of what RFK Jr. gets wrong appeared first on theconversation.com


Note: The following A.I. based commentary is not part of the original article, reproduced above, but is offered in the hopes that it will promote greater media literacy and critical thinking, by making any potential bias more visible to the reader –Staff Editor.

Political Bias Rating: Center-Left

This content presents a science-based and fact-checked critique of Robert F. Kennedy Jr.’s statements on vaccines, emphasizing the importance of established public health measures and vaccine safety. It supports mainstream medical consensus and public health institutions like the CDC, while challenging anti-vaccine rhetoric associated with certain political or ideological positions. The tone is objective but leans toward defending regulatory agencies and vaccine advocacy, which aligns more closely with Center-Left perspectives favoring public health expertise and government intervention in health policy.

Continue Reading

The Conversation

Cyberattacks shake voters’ trust in elections, regardless of party

Published

on

theconversation.com – Ryan Shandler, Professor of Cybersecurity and International Relations, Georgia Institute of Technology – 2025-06-27 07:29:00


American democracy faces a crisis of trust, with nearly half of Americans doubting election fairness. This mistrust stems not only from polarization and misinformation but also from unease about the digital infrastructure behind voting. While over 95% of ballots are now counted electronically, this complexity fuels skepticism, especially amid foreign disinformation campaigns that amplify doubts about election security. A study during the 2024 election showed that exposure to cyberattack reports, even unrelated to elections, significantly undermines voter confidence, particularly among those using digital voting machines. To protect democracy, it’s vital to pair secure technology with public education and treat trust as a national asset.

An election worker installs a touchscreen voting machine.
Ethan Miller/Getty Images

Ryan Shandler, Georgia Institute of Technology; Anthony J. DeMattee, Emory University, and Bruce Schneier, Harvard Kennedy School

American democracy runs on trust, and that trust is cracking.

Nearly half of Americans, both Democrats and Republicans, question whether elections are conducted fairly. Some voters accept election results only when their side wins. The problem isn’t just political polarization – it’s a creeping erosion of trust in the machinery of democracy itself.

Commentators blame ideological tribalism, misinformation campaigns and partisan echo chambers for this crisis of trust. But these explanations miss a critical piece of the puzzle: a growing unease with the digital infrastructure that now underpins nearly every aspect of how Americans vote.

The digital transformation of American elections has been swift and sweeping. Just two decades ago, most people voted using mechanical levers or punch cards. Today, over 95% of ballots are counted electronically. Digital systems have replaced poll books, taken over voter identity verification processes and are integrated into registration, counting, auditing and voting systems.

This technological leap has made voting more accessible and efficient, and sometimes more secure. But these new systems are also more complex. And that complexity plays into the hands of those looking to undermine democracy.

In recent years, authoritarian regimes have refined a chillingly effective strategy to chip away at Americans’ faith in democracy by relentlessly sowing doubt about the tools U.S. states use to conduct elections. It’s a sustained campaign to fracture civic faith and make Americans believe that democracy is rigged, especially when their side loses.

This is not cyberwar in the traditional sense. There’s no evidence that anyone has managed to break into voting machines and alter votes. But cyberattacks on election systems don’t need to succeed to have an effect. Even a single failed intrusion, magnified by sensational headlines and political echo chambers, is enough to shake public trust. By feeding into existing anxiety about the complexity and opacity of digital systems, adversaries create fertile ground for disinformation and conspiracy theories.

Just before the 2024 presidential election, Director of the Cybersecurity and Infrastructure Security Agency Jen Easterly explains how foreign influence campaigns erode trust in U.S. elections.

Testing cyber fears

To test this dynamic, we launched a study to uncover precisely how cyberattacks corroded trust in the vote during the 2024 U.S. presidential race. We surveyed more than 3,000 voters before and after election day, testing them using a series of fictional but highly realistic breaking news reports depicting cyberattacks against critical infrastructure. We randomly assigned participants to watch different types of news reports: some depicting cyberattacks on election systems, others on unrelated infrastructure such as the power grid, and a third, neutral control group.

The results, which are under peer review, were both striking and sobering. Mere exposure to reports of cyberattacks undermined trust in the electoral process – regardless of partisanship. Voters who supported the losing candidate experienced the greatest drop in trust, with two-thirds of Democratic voters showing heightened skepticism toward the election results.

But winners too showed diminished confidence. Even though most Republican voters, buoyed by their victory, accepted the overall security of the election, the majority of those who viewed news reports about cyberattacks remained suspicious.

The attacks didn’t even have to be related to the election. Even cyberattacks against critical infrastructure such as utilities had spillover effects. Voters seemed to extrapolate: “If the power grid can be hacked, why should I believe that voting machines are secure?”

Strikingly, voters who used digital machines to cast their ballots were the most rattled. For this group of people, belief in the accuracy of the vote count fell by nearly twice as much as that of voters who cast their ballots by mail and who didn’t use any technology. Their firsthand experience with the sorts of systems being portrayed as vulnerable personalized the threat.

It’s not hard to see why. When you’ve just used a touchscreen to vote, and then you see a news report about a digital system being breached, the leap in logic isn’t far.

Our data suggests that in a digital society, perceptions of trust – and distrust – are fluid, contagious and easily activated. The cyber domain isn’t just about networks and code. It’s also about emotions: fear, vulnerability and uncertainty.

Firewall of trust

Does this mean we should scrap electronic voting machines? Not necessarily.

Every election system, digital or analog, has flaws. And in many respects, today’s high-tech systems have solved the problems of the past with voter-verifiable paper ballots. Modern voting machines reduce human error, increase accessibility and speed up the vote count. No one misses the hanging chads of 2000.

But technology, no matter how advanced, cannot instill legitimacy on its own. It must be paired with something harder to code: public trust. In an environment where foreign adversaries amplify every flaw, cyberattacks can trigger spirals of suspicion. It is no longer enough for elections to be secure − voters must also perceive them to be secure.

That’s why public education surrounding elections is now as vital to election security as firewalls and encrypted networks. It’s vital that voters understand how elections are run, how they’re protected and how failures are caught and corrected. Election officials, civil society groups and researchers can teach how audits work, host open-source verification demonstrations and ensure that high-tech electoral processes are comprehensible to voters.

We believe this is an essential investment in democratic resilience. But it needs to be proactive, not reactive. By the time the doubt takes hold, it’s already too late.

Just as crucially, we are convinced that it’s time to rethink the very nature of cyber threats. People often imagine them in military terms. But that framework misses the true power of these threats. The danger of cyberattacks is not only that they can destroy infrastructure or steal classified secrets, but that they chip away at societal cohesion, sow anxiety and fray citizens’ confidence in democratic institutions. These attacks erode the very idea of truth itself by making people doubt that anything can be trusted.

If trust is the target, then we believe that elected officials should start to treat trust as a national asset: something to be built, renewed and defended. Because in the end, elections aren’t just about votes being counted – they’re about people believing that those votes count.

And in that belief lies the true firewall of democracy.The Conversation

Ryan Shandler, Professor of Cybersecurity and International Relations, Georgia Institute of Technology; Anthony J. DeMattee, Data Scientist and Adjunct Instructor, Emory University, and Bruce Schneier, Adjunct Lecturer in Public Policy, Harvard Kennedy School

This article is republished from The Conversation under a Creative Commons license. Read the original article.

Read More

The post Cyberattacks shake voters’ trust in elections, regardless of party appeared first on theconversation.com


Note: The following A.I. based commentary is not part of the original article, reproduced above, but is offered in the hopes that it will promote greater media literacy and critical thinking, by making any potential bias more visible to the reader –Staff Editor.

Political Bias Rating: Centrist

This article presents a balanced and fact-focused analysis of trust issues surrounding American elections, emphasizing concerns shared across the political spectrum. It highlights the complexity of digital voting infrastructure and the external threats posed by misinformation and foreign influence without promoting partisan viewpoints. The tone is neutral, grounded in data and research, avoiding ideological framing or advocacy. The piece calls for bipartisan solutions like public education and institutional trust-building, reflecting a centrist perspective that prioritizes democratic resilience over partisan blame.

Continue Reading

The Conversation

Toxic algae blooms are lasting longer than before in Lake Erie − why that’s a worry for people and pets

Published

on

theconversation.com – Gregory J. Dick, Professor of Biology, University of Michigan – 2025-06-26 14:38:00


Federal scientists forecast a mild to moderate harmful algal bloom season in Lake Erie for 2025, though even moderate blooms pose health risks. Harmful algal blooms, mainly caused by excess phosphorus and nitrogen runoff from agriculture, produce toxins harmful to humans, pets, and ecosystems. Recent DNA research revealed new toxins, including microcystins and saxitoxins, raising emerging concerns. Climate change exacerbates blooms by increasing water temperatures and heavy rainfall. Blooms now start earlier and last longer. Reducing nutrient runoff through improved farming practices and wetland restoration, like Ohio’s H2Ohio program, is essential to mitigating future blooms and protecting water quality.

A satellite image from Aug. 13, 2024, shows an algal bloom covering approximately 320 square miles (830 square km) of Lake Erie. By Aug. 22, it had nearly doubled in size.
NASA Earth Observatory

Gregory J. Dick, University of Michigan

Federal scientists released their annual forecast for Lake Erie’s harmful algal blooms on June 26, 2025, and they expect a mild to moderate season. However, anyone who comes in contact with toxic algae can face health risks. And 2014, when toxins from algae blooms contaminated the water supply in Toledo, Ohio, was a moderate year, too.

We asked Gregory J. Dick, who leads the Cooperative Institute for Great Lakes Research, a federally funded center at the University of Michigan that studies harmful algal blooms among other Great Lakes issues, why they’re such a concern.

A bar chart shows 2025's forecast to be more severe than 2023 but less than 2024.
The National Oceanic and Atmospheric Administration’s prediction for harmful algal bloom severity in Lake Erie compared with past years.
NOAA

1. What causes harmful algal blooms?

Harmful algal blooms are dense patches of excessive algae growth that can occur in any type of water body, including ponds, reservoirs, rivers, lakes and oceans. When you see them in freshwater, you’re typically seeing cyanobacteria, also known as blue-green algae.

These photosynthetic bacteria have inhabited our planet for billions of years. In fact, they were responsible for oxygenating Earth’s atmosphere, which enabled plant and animal life as we know it.

An illustration of algae bloom sources shows a farm field, city and large body of water.
The leading source of harmful algal blooms today is nutrient runoff from fertilized farm fields.
Michigan Sea Grant

Algae are natural components of ecosystems, but they cause trouble when they proliferate to high densities, creating what we call blooms.

Harmful algal blooms form scums at the water surface and produce toxins that can harm ecosystems, water quality and human health. They have been reported in all 50 U.S. states, all five Great Lakes and nearly every country around the world. Blue-green algae blooms are becoming more common in inland waters.

The main sources of harmful algal blooms are excess nutrients in the water, typically phosphorus and nitrogen.

Historically, these excess nutrients mainly came from sewage and phosphorus-based detergents used in laundry machines and dishwashers that ended up in waterways. U.S. environmental laws in the early 1970s addressed this by requiring sewage treatment and banning phosphorus detergents, with spectacular success.

How pollution affected Lake Erie in the 1960s, before clean water regulations.

Today, agriculture is the main source of excess nutrients from chemical fertilizer or manure applied to farm fields to grow crops. Rainstorms wash these nutrients into streams and rivers that deliver them to lakes and coastal areas, where they fertilize algal blooms. In the U.S., most of these nutrients come from industrial-scale corn production, which is largely used as animal feed or to produce ethanol for gasoline.

Climate change also exacerbates the problem in two ways. First, cyanobacteria grow faster at higher temperatures. Second, climate-driven increases in precipitation, especially large storms, cause more nutrient runoff that has led to record-setting blooms.

2. What does your team’s DNA testing tell us about Lake Erie’s harmful algal blooms?

Harmful algal blooms contain a mixture of cyanobacterial species that can produce an array of different toxins, many of which are still being discovered.

When my colleagues and I recently sequenced DNA from Lake Erie water, we found new types of microcystins, the notorious toxins that were responsible for contaminating Toledo’s drinking water supply in 2014.

These novel molecules cannot be detected with traditional methods and show some signs of causing toxicity, though further studies are needed to confirm their human health effects.

A young woman and dog walk along a shoreline with blue-green algae in the water.
Blue-green algae blooms in freshwater, like this one near Toledo in 2014, can be harmful to humans, causing gastrointestinal symptoms, headache, fever and skin irritation. They can be lethal for pets.
Ty Wright for The Washington Post via Getty Images

We also found organisms responsible for producing saxitoxin, a potent neurotoxin that is well known for causing paralytic shellfish poisoning on the Pacific Coast of North America and elsewhere.

Saxitoxins have been detected at low concentrations in the Great Lakes for some time, but the recent discovery of hot spots of genes that make the toxin makes them an emerging concern.

Our research suggests warmer water temperatures could boost its production, which raises concerns that saxitoxin will become more prevalent with climate change. However, the controls on toxin production are complex, and more research is needed to test this hypothesis. Federal monitoring programs are essential for tracking and understanding emerging threats.

3. Should people worry about these blooms?

Harmful algal blooms are unsightly and smelly, making them a concern for recreation, property values and businesses. They can disrupt food webs and harm aquatic life, though a recent study suggested that their effects on the Lake Erie food web so far are not substantial.

But the biggest impact is from the toxins these algae produce that are harmful to humans and lethal to pets.

The toxins can cause acute health problems such as gastrointestinal symptoms, headache, fever and skin irritation. Dogs can die from ingesting lake water with harmful algal blooms. Emerging science suggests that long-term exposure to harmful algal blooms, for example over months or years, can cause or exacerbate chronic respiratory, cardiovascular and gastrointestinal problems and may be linked to liver cancers, kidney disease and neurological issues.

A large round structure offshore is surrounded by blue-green algae.
The water intake system for the city of Toledo, Ohio, is surrounded by an algae bloom in 2014. Toxic algae got into the water system, resulting in residents being warned not to touch or drink their tap water for three days.
AP Photo/Haraz N. Ghanbari

In addition to exposure through direct ingestion or skin contact, recent research also indicates that inhaling toxins that get into the air may harm health, raising concerns for coastal residents and boaters, but more research is needed to understand the risks.

The Toledo drinking water crisis of 2014 illustrated the vast potential for algal blooms to cause harm in the Great Lakes. Toxins infiltrated the drinking water system and were detected in processed municipal water, resulting in a three-day “do not drink” advisory. The episode affected residents, hospitals and businesses, and it ultimately cost the city an estimated US$65 million.

4. Blooms seem to be starting earlier in the year and lasting longer – why is that happening?

Warmer waters are extending the duration of the blooms.

In 2025, NOAA detected these toxins in Lake Erie on April 28, earlier than ever before. The 2022 bloom in Lake Erie persisted into November, which is rare if not unprecedented.

Scientific studies of western Lake Erie show that the potential cyanobacterial growth rate has increased by up to 30% and the length of the bloom season has expanded by up to a month from 1995 to 2022, especially in warmer, shallow waters. These results are consistent with our understanding of cyanobacterial physiology: Blooms like it hot – cyanobacteria grow faster at higher temperatures.

5. What can be done to reduce the likelihood of algal blooms in the future?

The best and perhaps only hope of reducing the size and occurrence of harmful algal blooms is to reduce the amount of nutrients reaching the Great Lakes.

In Lake Erie, where nutrients come primarily from agriculture, that means improving agricultural practices and restoring wetlands to reduce the amount of nutrients flowing off of farm fields and into the lake. Early indications suggest that Ohio’s H2Ohio program, which works with farmers to reduce runoff, is making some gains in this regard, but future funding for H2Ohio is uncertain.

In places like Lake Superior, where harmful algal blooms appear to be driven by climate change, the solution likely requires halting and reversing the rapid human-driven increase in greenhouse gases in the atmosphere.The Conversation

Gregory J. Dick, Professor of Biology, University of Michigan

This article is republished from The Conversation under a Creative Commons license. Read the original article.

Read More

The post Toxic algae blooms are lasting longer than before in Lake Erie − why that’s a worry for people and pets appeared first on theconversation.com


Note: The following A.I. based commentary is not part of the original article, reproduced above, but is offered in the hopes that it will promote greater media literacy and critical thinking, by making any potential bias more visible to the reader –Staff Editor.

Political Bias Rating: Centrist

This article presents a neutral and factual overview of the harmful algal blooms in Lake Erie, relying on scientific data and expert analysis without promoting a political agenda. It references federal and academic research, explains causes like agricultural runoff and climate change, and discusses practical mitigation efforts such as agricultural practice improvements and wetland restoration. The tone is informative and balanced, avoiding partisan framing or ideological language. While it touches on environmental issues that can be politically charged, the article remains focused on evidence-based explanations and policy-neutral recommendations.

Continue Reading

Trending